Over the three months ending August 2026, the median sale price for a home in East Memphis climbed to $347,000, up 15.6% from the same stretch a year earlier. Read that number on its own and East Memphis looks like the hottest pocket of the Memphis market this year. Then look at the number sitting right next to it: the median price per square foot over that same window was $148, down 3.6% from a year ago.
Those two figures cannot both describe a neighborhood getting broadly more expensive. One says East Memphis costs more. The other says it costs less, once you account for the size of what's actually selling. Something else is going on, and it matters for anyone trying to price a listing, size up a comp, or figure out what a "hot" neighborhood actually means before they write an offer.
What the Median Actually Counts
A median sale price tells you the midpoint of whatever homes closed in a given window. It says nothing about square footage, lot size, condition, or which streets those homes sat on. If the mix of homes selling shifts toward larger, pricier, more recently updated properties, the median rises even if nothing about the underlying market got more expensive on a per-square-foot basis. That's exactly what the East Memphis numbers point to. Fewer homes changed hands in August 2026 than a year earlier, 182 compared to 201, and they took longer to do it, averaging 35 days on market versus 30 the year before. Fewer transactions, longer timelines, and a higher median paired with a lower price per square foot is not the signature of a neighborhood getting more competitive across the board. It's the signature of a smaller, different slice of the market doing the selling.
Compare that pattern to Memphis as a whole over the identical window. Citywide, the median sale price fell 2.2% to $187,000, and price per square foot fell 7.8% to $118. Both numbers moved in the same direction. That's what a market actually softening looks like: fewer dollars per home and fewer dollars per square foot, moving together. East Memphis broke that pattern. Its two core price metrics pulled in opposite directions, which is the tell that the story isn't appreciation or depreciation. It's a shift in which homes are transacting.
| Market | Median sale price (3 mo. ending Aug 2026) | YoY change | Price per sq. ft. | YoY change |
|---|---|---|---|---|
| Memphis (citywide) | $187,000 | down 2.2% | $118 | down 7.8% |
| East Memphis | $347,000 | up 15.6% | $148 | down 3.6% |
East Memphis Isn't One Price Band
Part of why a mix shift can move the median this much is that East Memphis isn't a single market. It's a patchwork of distinct pockets with very different housing stock, and the ZIP codes inside it span a wide range. Some run in the high $300,000s to low $400,000s. At least one, 38139, regularly clears $600,000. Pockets known for larger, more recently renovated homes, including Kirby Woods and River Oaks, tend to take longer to sell than the East Memphis average, which fits a market where the higher end is absorbing more of the closed sales while smaller, lower-priced stock sits.
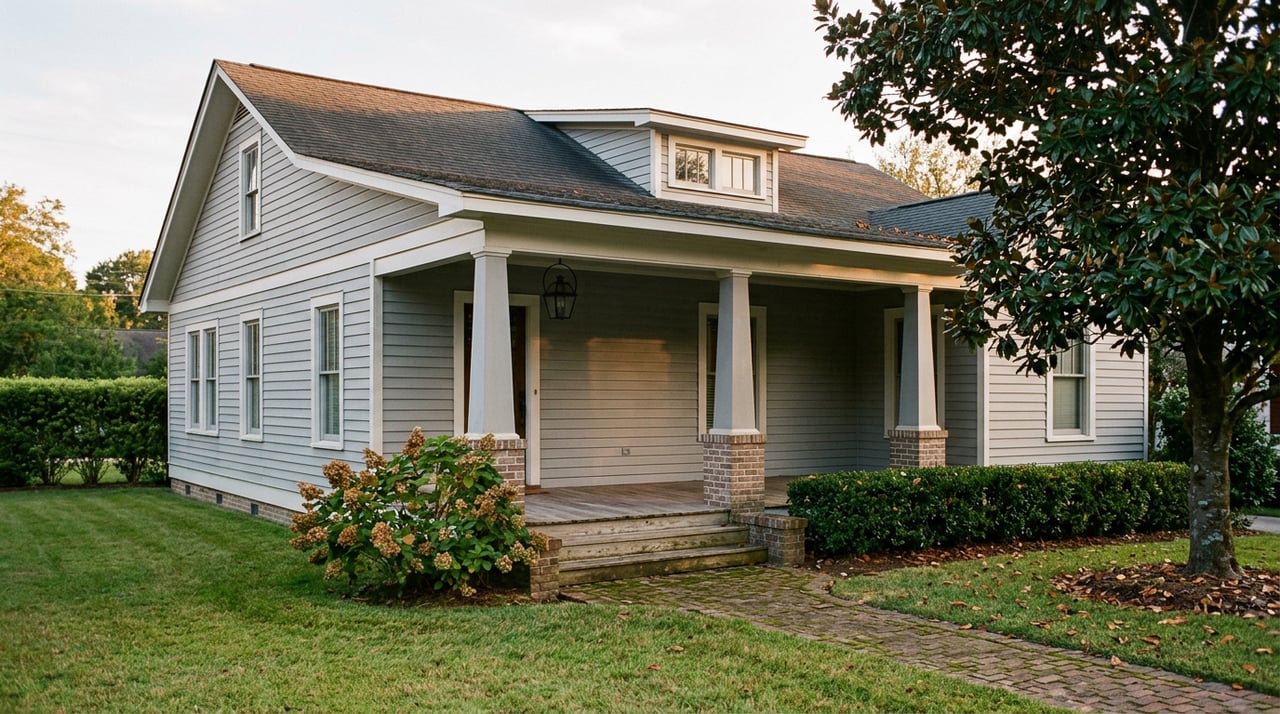
Chickasaw Gardens is a good example of how much texture sits inside the "East Memphis" label. The neighborhood centers on Chickasaw Gardens Park, home to a 22-acre lake with a paved walking trail, and residents also have access to Tobey Park's sports fields, dog park, and skate park nearby. Inside the subdivision at its core, homes run from farmhouse and Colonial Revival styles up into the seven figures. The rest of the neighborhood is a different animal entirely: brick ranch houses, bungalows, and condo buildings priced well under $400,000. Two homes ten minutes apart, both technically "East Memphis," can sit on opposite ends of the market in both size and price per square foot. When the mix of what's selling tilts even slightly toward the Chickasaw Gardens end of that spectrum instead of the ranch-and-bungalow end, the median moves a lot. The per-square-foot number moves less, because it's measuring something closer to what a buyer is actually paying for space, regardless of which pocket that space sits in.
What the Slower Pace Adds to the Picture
The days-on-market shift backs this up. If East Memphis were simply getting more competitive across the board, you'd expect homes to sell faster, not slower, as buyers raced to keep up with rising prices. Instead, the average climbed from 30 to 35 days even as the median rose. That combination, a higher price tag paired with a slower sale, usually means the properties clearing the market skew toward homes that take more time to sell in the first place. Larger homes, higher-priced homes, and homes in pockets like Kirby Woods and River Oaks typically move slower than smaller starter properties. If more of August's closings came from that end of the market than a year ago, you'd see exactly this pattern: median up, pace down, and the broader per-square-foot cost of housing actually easing.
None of this means East Memphis demand disappeared. It means the headline number is describing a change in composition, not a uniform 15.6% markup on every address in the neighborhood.
What This Means If You're Pricing a Listing or Sizing Up an Offer
If you're getting ready to list a home in East Memphis, the median telling you the neighborhood is "up 15%" is not permission to price 15% ahead of where a comparable home sold last year. Your comp needs to match on size and pocket, not just on ZIP code or school zone. A 2,400-square-foot home in a ranch-and-cottage stretch of Chickasaw Gardens is not competing against a renovated four-bedroom in Kirby Woods, even though both technically sold "in East Memphis" this year. Price per square foot, tracked within your specific pocket rather than across the whole neighborhood label, is the more honest yardstick right now.
If you're a buyer weighing whether East Memphis has gotten too expensive to enter, the price-per-square-foot decline is the more useful number to sit with. It suggests that on a like-for-like basis, buyers are not paying more for the same amount of house than they were a year ago. What's changed is which houses are available and closing. A buyer targeting the same size and condition of home that was on the market last year may find the math friendlier than the median headline implies, particularly outside the highest-demand pockets where longer marketing times can mean more room to negotiate.
The practical move, whether you're selling or buying, is to ask which East Memphis you're actually transacting in before you anchor to a citywide or neighborhood-wide number. The Memphis Area Association of Realtors tracks monthly sales data for Shelby County broken out by area, and that level of detail is a better starting point than a single median for the whole neighborhood.
FAQ
Does the falling price per square foot mean East Memphis homes are a better deal right now than the median suggests? It means buyers are not paying more per square foot than they were a year ago, on average, even though the typical closed sale price is higher. Whether that translates into a better deal depends on the specific pocket and property, since the pockets driving the median higher, like Kirby Woods and River Oaks, are not typically where the best per-square-foot value shows up.
Should I wait for prices to come down before buying in East Memphis? The data doesn't point to a broad price decline. It points to a shift in which homes are selling. Waiting for the median to fall assumes the whole market is overheated, but the per-square-foot number suggests the cost of comparable space has already eased over the past year rather than climbed.
Interpreting a headline number for one specific street or one specific listing is exactly the kind of work that benefits from someone who tracks East Memphis pocket by pocket rather than by a single citywide figure. Ware Jones works East Memphis and its surrounding enclaves every week and can walk you through what the current data actually means for your address before you set a price or make an offer.